
How Collaborative AI Analytics are Revamping Data Work
And Why the Best Data Teams Are Becoming Problem-Solving Squads (with Ollie Hughes)


The CEO has a problem. Revenue’s down 15% this quarter. Who do they call?
If your answer is “the data team,” you’re thinking about analytics the right way. If your answer is “wait for the weekly dashboard refresh,” you’re stuck in the old model.
Ollie Hughes, co-founder of Count, spent years as a management consultant going into factories across Europe and figuring out why production lines weren’t hitting targets. He’d show up at a can-making factory in Germany, not speaking the language, armed with a stopwatch and a notebook. His job was to make that factory run twice as fast.
What he learned there shaped how he thinks about data teams today.
The factory floor mindset
When Ollie walked into those factories, he had to understand the entire system fast. Where’s the bottleneck? What data exists? What’s just tribal knowledge that nobody’s written down?
He’d dig through the data, trace problems back to root causes, and often find that one dial on one machine was holding back the entire operation. Turn it from two to seven, and suddenly the whole factory starts making money again.
That kind of problem-solving is what data teams should be doing for their companies. Not building dashboards. Not running reports. Solving actual business problems.
Visualize the business first
Ollie’s core belief: the role of a data team is to support and facilitate great business improvement. And the way you do that is by helping the business see itself clearly.
Most companies don’t have a clear view of their own growth model. They have dashboards showing metrics, sure. But they don’t have a shared mental model of how the business actually works. What drives revenue? What are the second-order effects when marketing spend goes up? How do different parts of the business connect?
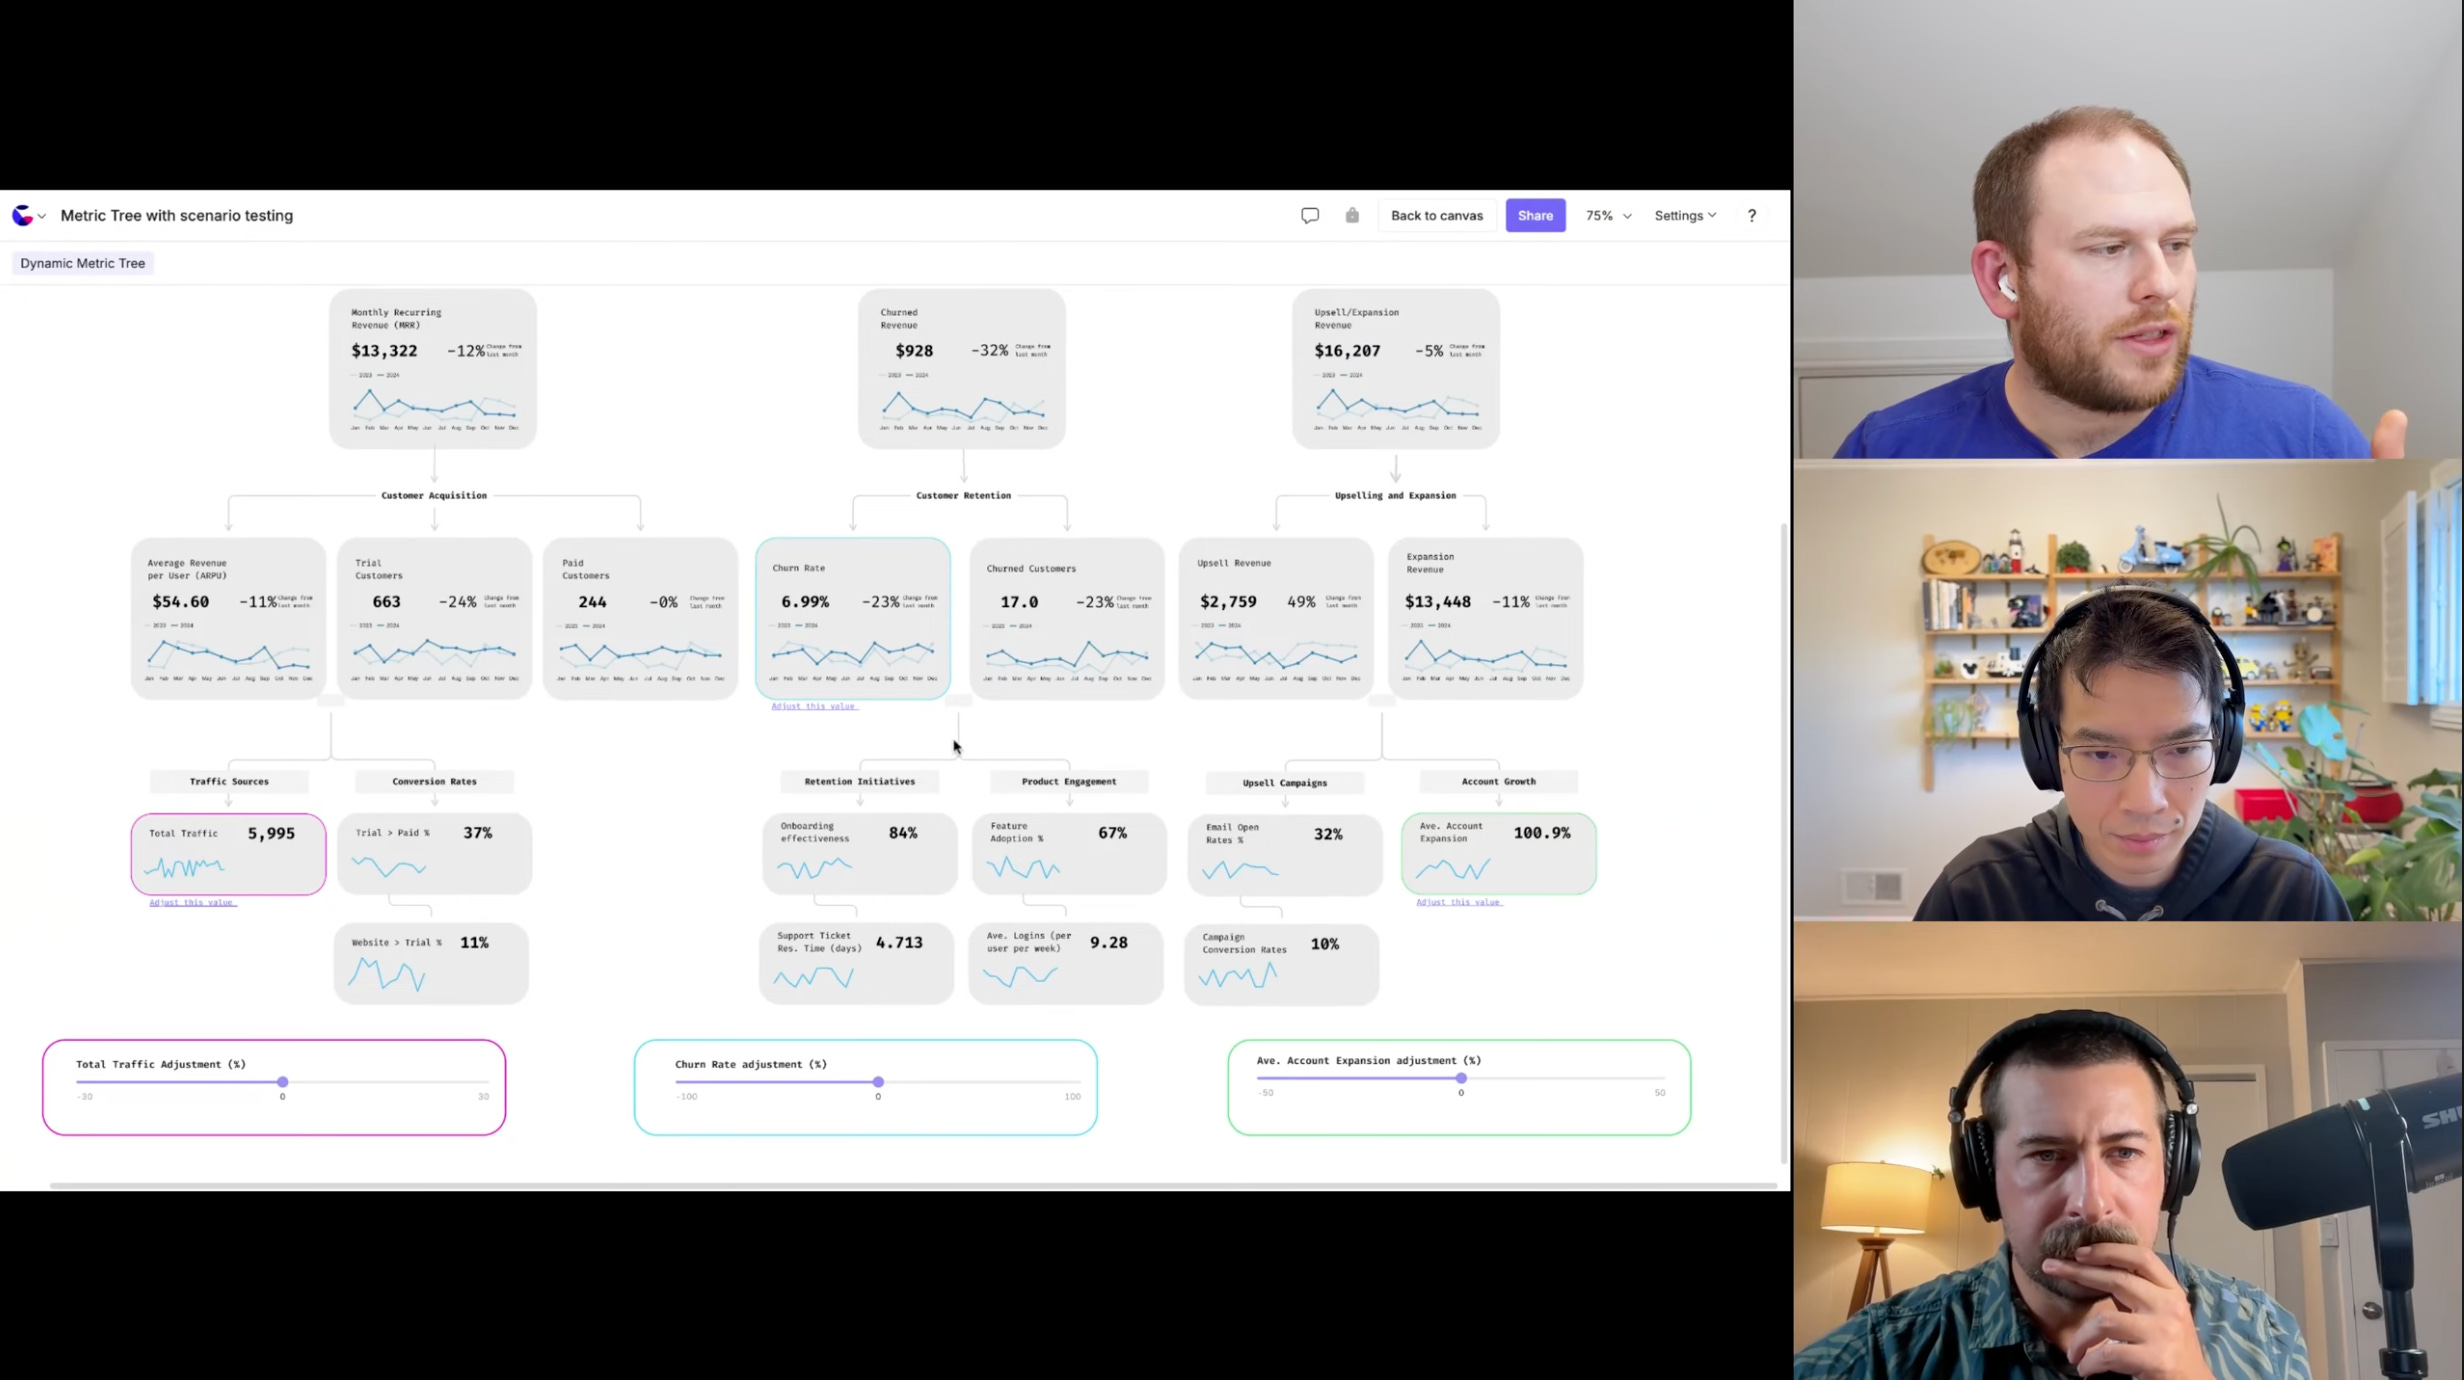
Count’s approach is to build what Ollie calls a “metric tree” - a visual map of how your entire business fits together. Not just metrics on a page, but the actual relationships between them. When you can see that GMV is driven by active buyers and average order value, and those are driven by these other factors, and those are driven by these initiatives - now you’re working with a shared understanding.
Problem-solving as a team sport
Here’s where most AI analytics tools get it wrong: they assume one person asks a question, the AI gives an answer, and that person goes off and does something with it.
But that’s not how business problems get solved. Problems get solved in rooms with multiple people, looking at the same information, debating what it means, deciding what to do.
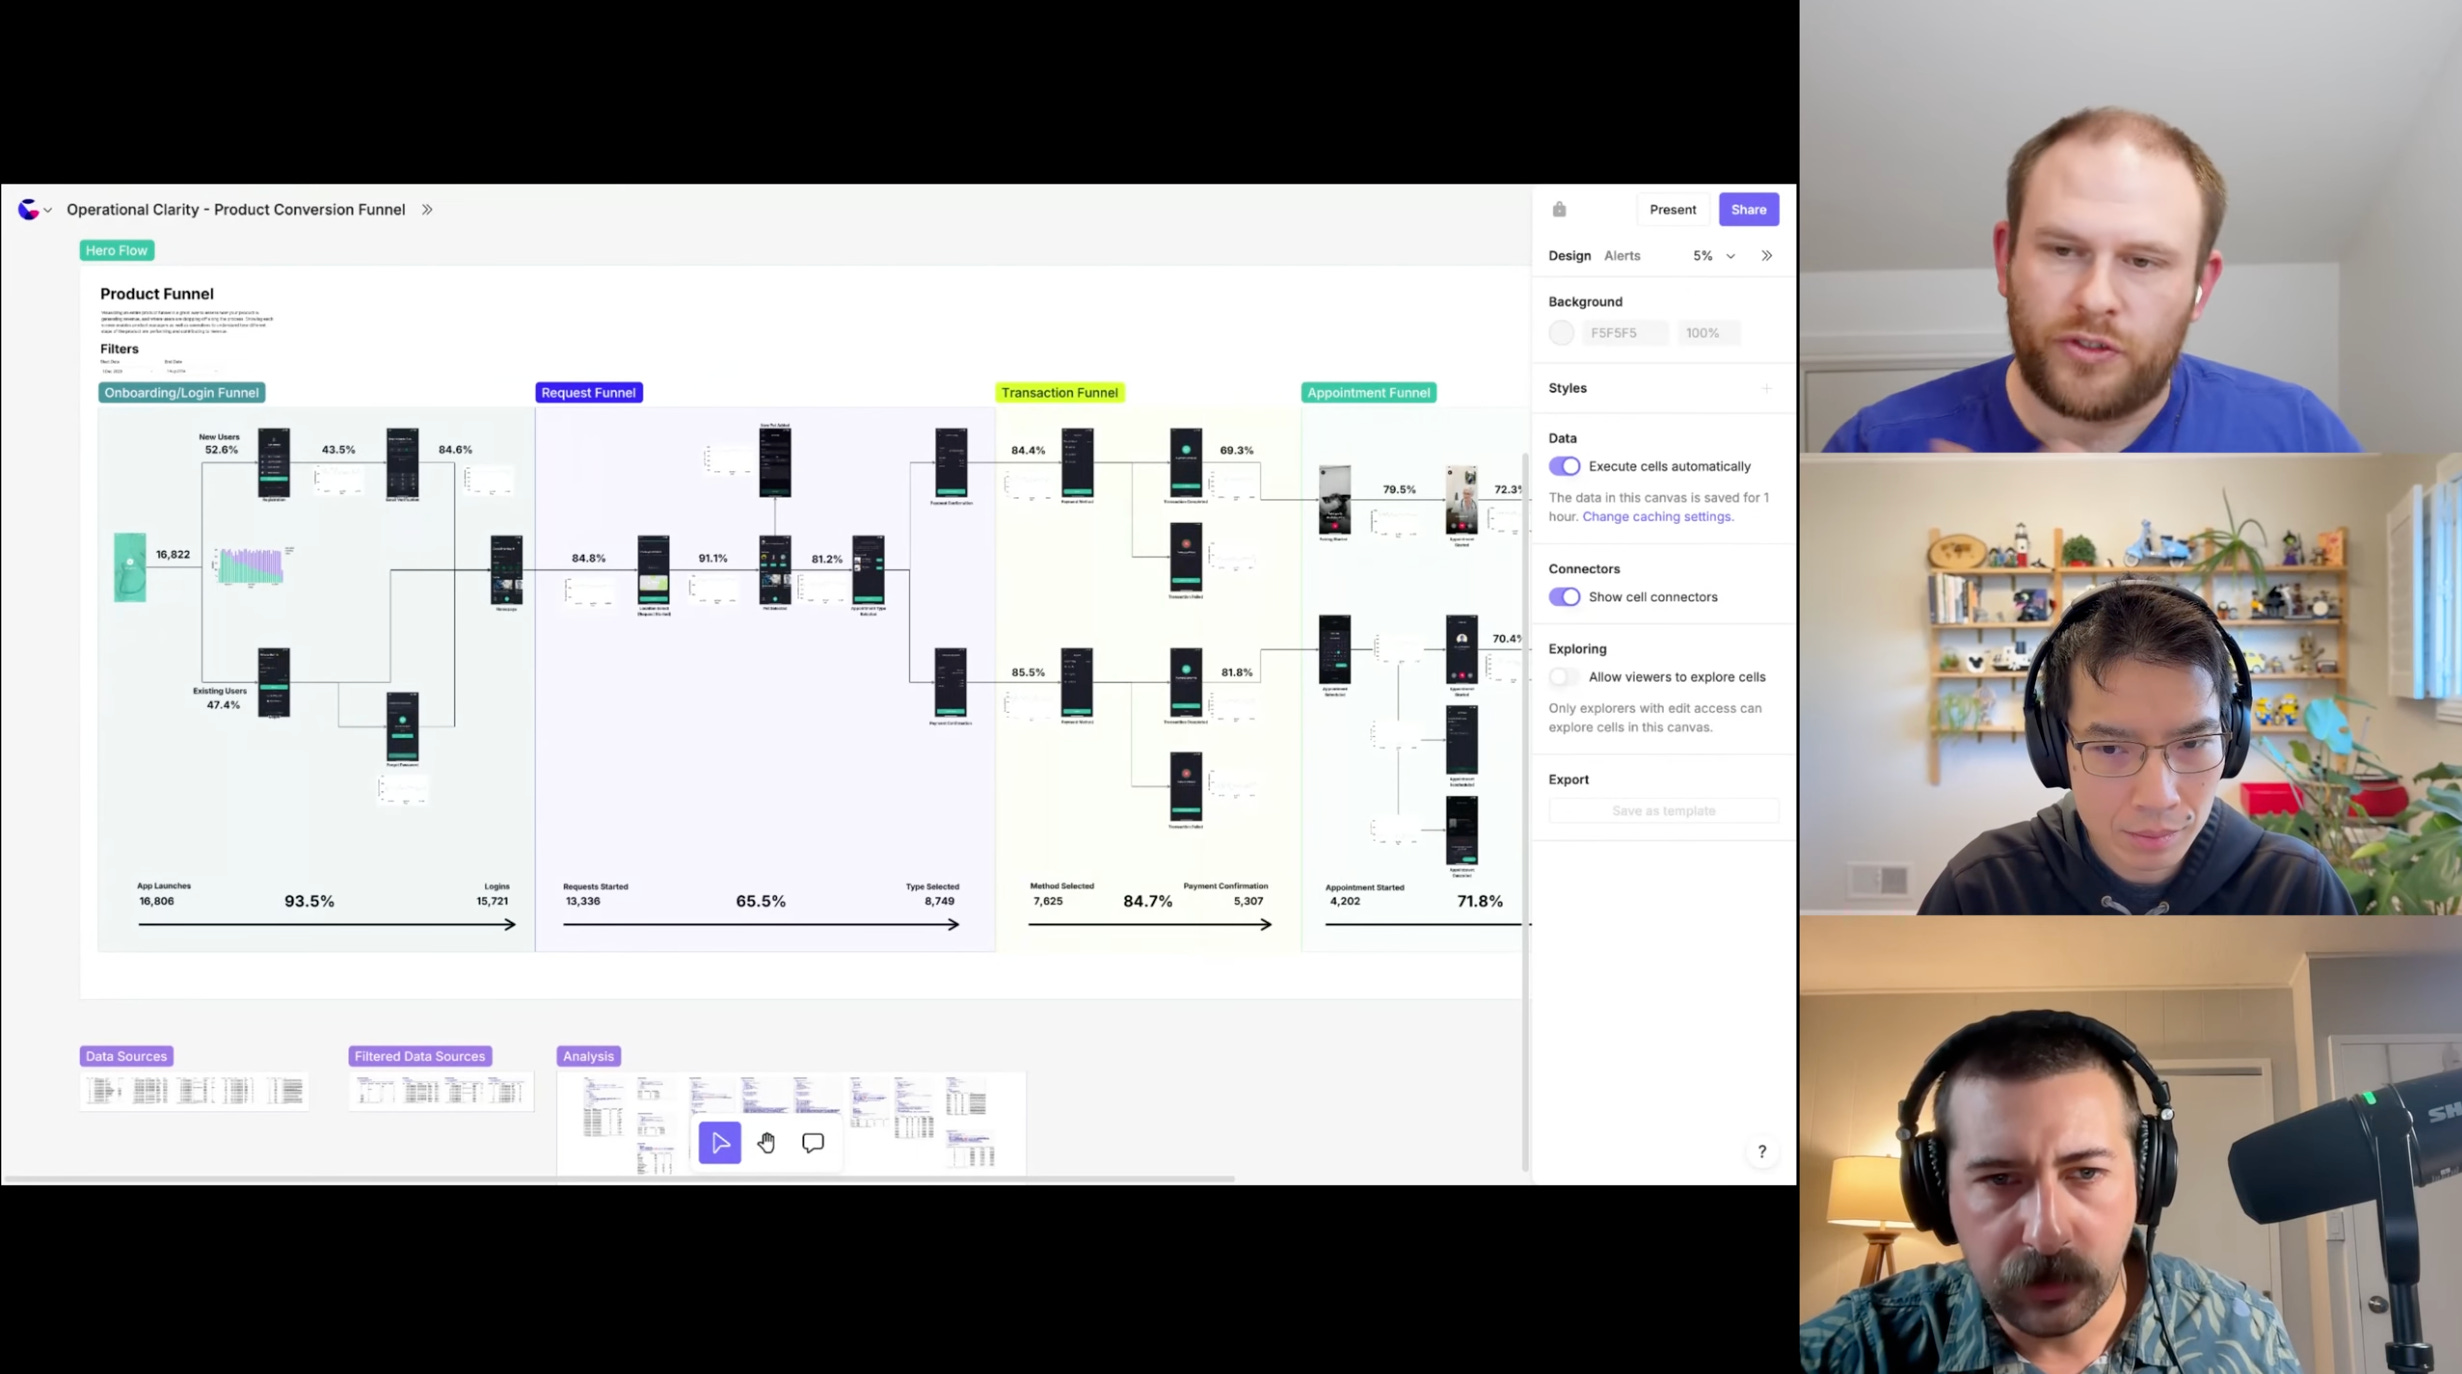
When we saw Ollie demo Count’s AI agent, this clicked. The AI doesn’t just answer questions. It lays out the problem, breaks it into components, digs into each one, and presents everything in a way that multiple people can interact with together.
One person can ask the AI to investigate why conversion dropped. Someone else can jump in and adjust the time period. A third person can drill into a specific segment. Everyone’s looking at the same canvas, editing the same queries, building shared context in real time.
Everything is transparent and editable
This is critical: when the AI generates analysis, you can see exactly how it’s built. The queries are visible. The logic is traceable. You can edit any part yourself, and the AI recognizes those changes and incorporates them.
No black boxes. No “the model says so.” Just transparent analysis that anyone on the team can verify and build on.
Ollie demonstrated this by having the AI investigate a revenue dip. The AI automatically broke down the problem - was it fewer customers? Lower average order value? Changes in specific segments? It drilled into each factor, showed the data, and explained what it found.
But here’s the key: at any point, a human could step in and say “actually, look at this cohort differently” or “check this time period instead.” The AI adapts. It’s collaborative problem-solving, not automated answer-generation.
The deeper you go
One thing that stood out: Ollie mentioned the AI often goes deeper than he would himself, given time constraints. It pursues lines of investigation that a human might not have bandwidth for.
This is where AI actually helps. Not by replacing human judgment, but by doing the grunt work of checking every angle, running multiple cuts of the data, and laying out all the evidence so humans can make better decisions.
What this means for data teams
Ollie’s advice for data teams: position yourselves as the organization’s problem-solving squad. The CEO has a problem? You’re the people who can help think it through.
You already have the superpowers needed for this:
Visibility across the entire business
Strong problem-solving skills
Ability to work with complex, ambiguous situations
The challenge is making sure those strengths are visible and valued. That means defining your purpose clearly - we’re here to help the business improve- and working in ways that amplify those strengths rather than getting lost in routine reporting.
You can do this with whatever tools you have today. But as AI gets integrated into analytics workflows, the teams that will thrive are the ones who understand their role is problem-solving, not dashboard-building.
Ready to level up your analytics skills?
We’re offering two new learning opportunities:
Free workshops: We’re running a series on AI evaluation and agentic analytics. Topics include analyzing product data with no-code tools, designing AI evaluation plans, creating custom annotation tools, and more. Full schedule at dataneighbor.com.
Cohort-based courses:
AI Analytics for Builders: Learn to leverage AI to become your own product data scientist, or magnify your impact as a data scientist. Claim your 20% discount here.
AI Evaluations for Product Development: Learn to measure the actual impact of AI features on user and business outcomes. Claim your 20% discount here.
Both are hands-on, practical, 5-6 week programs where you’ll work with us and other practitioners in the field. Check it out at dataneighbor.com.
First time seeing collaborative agentic analytics workflow, definitely eye-opening and enables a sea of possibilities